Data Preparation and Recoding
- Structuring and Recoding Your Data
- Converting Strings to Numeric Values
- Preparation for Statistical Analysis

We’re happy to assist you with your SPSS analysis. Take advantage of our expertise. Our experienced statisticians will guide you through every step of the process—from preparing and cleaning your data to selecting appropriate statistical methods, and finally to professionally analyzing and clearly interpreting the results. You’ll receive exactly the support that’s tailored to your research question, your dataset, and your project.

Experience, Expertise, and Quality
for your SPSS analysis.

Depending on your needs, we handle data preparation, the selection of appropriate statistical methods, analysis, and the interpretation of results. You’ll receive expert and transparent support throughout the process. As a full-service statistics provider, we handle your entire SPSS analysis, which means:
Testimonials and case studies show how customers experience SPSS analyses at NOVUSTAT. For more than ten years, our services have been backed by expert knowledge and proven in practice.




Of course, you will also receive the SPSS file of the cleansed data set if required, so that you can carry out further evaluations yourself at any time.
We offer statistical consulting for analyses you conduct yourself and guide you step by step through the process. Alternatively, we can review your results and the methodology used to arrive at them after the fact. This is particularly important when you’re analyzing a questionnaire for your bachelor’s thesis, master’s thesis, or doctoral dissertation. We can also retrospectively review and validate the testing of hypotheses against the null hypothesis. For student projects, Novustat additionally offers SPSS and statistics support for bachelor’s theses when data analysis, methodology, and interpretation of results must align seamlessly.
As a professional statistics service provider, Novustat supports you in your SPSS analysis with the following services, for example:


Senior statistician

We’d be happy to assist you with your SPSS analysis or provide personalized SPSS coaching. Our experienced statisticians will guide you through every step—from preparing your data and selecting suitable statistical methods to conducting the analysis and clearly interpreting the results. Benefit from our methodological expertise in checking assumptions, testing hypotheses, and documenting your findings.


To perform an SPSS analysis of your statistical data, you still need a solid understanding of statistics, despite all the support this tool offers. Since SPSS performs the calculations automatically, it may seem as though you don’t need to know the formulas used. However, you should still be familiar with them so that you understand the meaning of the parameters that SPSS calculates. In addition, you should know which statistical analysis methods can be applied to which types of data, even though SPSS checks some of these prerequisites. To understand any error messages or warnings that may appear, you must also be familiar with both the prerequisites and the principles of statistical analysis.
SPSS is a fee-based software from IBM that supports the most common statistical evaluations. Like Stata, the program has a window-controlled menu interface. This largely avoids having to deal with the programming language, the so-called SPSS syntax.
However, due to its wide range of features and customization options, learning to use SPSS and work with it is not easy. The user interface encourages “trial and error,” but users often lack the methodological background needed—especially when it comes to interpreting the results of hypothesis testing, as is frequently required in a bachelor’s thesis, master’s thesis, or doctoral dissertation.
To use IBM SPSS Statistics effectively, one needs more than just professional expertise and relevant experience and proficiency in theoretical and applied statistics. We are frequently approached by students majoring in business administration, medicine, psychology, and mathematics. We offer SPSS introductions and tutoring tailored to the needs of graduates and students, specifically to assist with the preparation of theses, such as bachelor’s and master’s theses. Through SPSS consulting, we can also help students and doctoral candidates prepare for university statistics courses, which are usually required for students majoring in mathematics and psychology.
There are many things to consider when using SPSS for an evaluation. There are different windows in SPSS, each of which must be saved separately: Data window, output window and syntax window. The data entry of the variables from your questionnaire is done in SPSS in tabular form: one row per data set and one column per variable. The data itself is often imported from other applications, for example an existing statistic with Excel or as a *.csv file. These files, in turn, are created by online survey tools from the respondents’ answers or by manually typing in paper-based questionnaires. SPSS itself stores its data as a *.sps file or *.spo file. However, data can also be exported as a *.csv file for further processing with another tool.
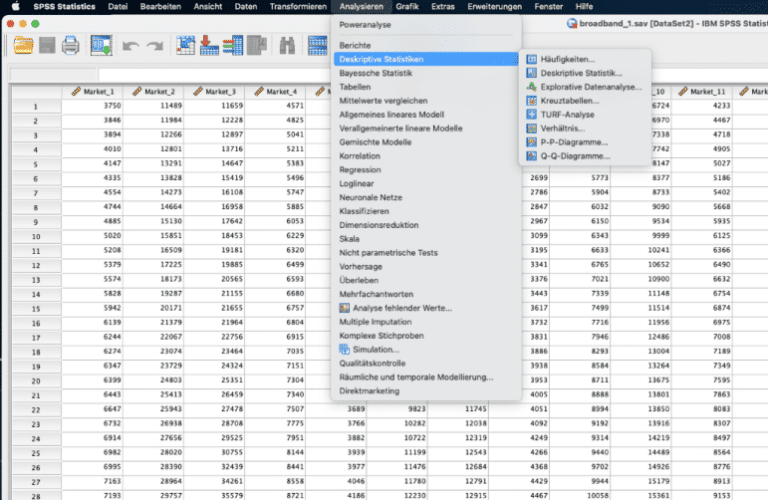
SPSS also supports data cleaning: You can recode data, calculate a single variable from multiple variables, create cross-tables from the data, identify outliers, filter out incomplete data sets based on user-defined criteria, or replace missing values with appropriate values. Without data cleaning, both simple descriptive calculations—such as calculating the mean—and complex analyses—such as examining relationships between individual variables—can yield incorrect results.
The various statistical procedures are initially accessed through the SPSS menu (the “Analysis” menu item). Graphs can also be created, such as histograms (the “Graphs” menu item). When performing statistical analyses based on descriptive statistics, SPSS checks whether the data meet the requirements for that statistical method. The results of the analyses are generally displayed in a table in the SPSS Viewer; therefore, to interpret them in light of the hypotheses, you should be thoroughly familiar with the statistical method used.
Specifically, the following SPSS analyses can be performed, for example:
When the standard functions aren’t enough, the SPSS AMOS module comes into play. It specializes in analyzing complex (causal) relationships between variables using structural equation modeling. In these models, not only are the directly observed variables (indicators) examined, but unobserved, so-called latent variables (factors) are also modeled.
01
Theoretical Framework and Hypothesis Formulation
02
Determination of Latent Variables
03
Validation of the Measurement Model
04
Testing the structural model and nested models
The intuitive graphical user interface allows users to create path diagrams visually using drag-and-drop. For customization, experienced users can also integrate their own programs written in C++ or Visual Basic via the Amos Basic Interpreter.
When it comes to structural equation modeling, the question of which tool to use often arises. SmartPLS serves a similar purpose as AMOS. While AMOS makes distribution assumptions about the variables, SmartPLS uses the variance-based PLS method. This makes SmartPLS the better choice when data are not normally distributed or when you are working with very small datasets, where AMOS reaches its methodological limits.
NOVUSTAT
Appropriate statistical measures by scale level
| Statistical Measures | | | |
|---|---|---|---|
| Measures of trend |
|
|
|
| Measures of Variability | This doesn't make sense, since numbers are not significant and serve only to distinguish between categories or characteristics. |
|
|
| Relationship Dimensions |
|
|
|
The syntax of an analysis can, however, be saved as pseudocode. This is useful if you want to repeat the same analysis later with different, more complete, or cleaned data. Users can thus use this syntax to document their analyses. It is also possible to program calculations, for example, in the form of macros. A very commonly used macro for SPSS is, for example, “Process” by Andrew Hayes for mediation and moderation analyses.
For those using SPSS for the first time as part of their data analysis, Novustat is happy to provide professional SPSS support. For projects that are to be implemented specifically in R rather than in SPSS, Novustat also offers professional R analysis.
NOVUSTAT provides personalized, expert, and reliable support for your SPSS analysis. Whether you need help with SPSS syntax, comprehensive data analysis using SPSS, or interpreting your results, we’ll assign a qualified statistics expert to your project who will carefully review your research question, data set, and scientific requirements.
You’ll receive personalized SPSS consulting and exactly the support you need for your master’s thesis, dissertation, research paper, or business analysis. Use our contact form to schedule a free consultation and receive a no-obligation quote—or give us a call directly.

 Privacy Preference
We need your consent before you can continue on our website. We use cookies and other technologies on our website. Some of them are essential, while others help us to improve this website and your experience. Personal data may be processed (e.g. IP addresses), for example for personalized ads and content or ad and content measurement. You can find more information about the use of your data in our privacy policy. You can revoke or adjust your selection at any time under Settings.
Privacy PreferenceWe use cookies and other technologies on our website. Some of them are essential, while others help us to improve this website and your experience. Personal data may be processed (e.g. IP addresses), for example for personalized ads and content or ad and content measurement. You can find more information about the use of your data in our privacy policy. Here you will find an overview of all cookies used. You can give your consent to whole categories or display further information and select certain cookies.