Request a customized data analysis for your project.
Our statisticians will review your data, research question, and project goals and recommend the most appropriate analysis method.

Let us provide you with professional and personalized support for your data analysis. Whether you’re just getting started with statistical data analysis or have already moved on to interpreting the results—our statisticians are happy to help! At Novustat, you can have your statistics analyzed by experts.

Experience, Expertise, and Quality
for your data analysis.

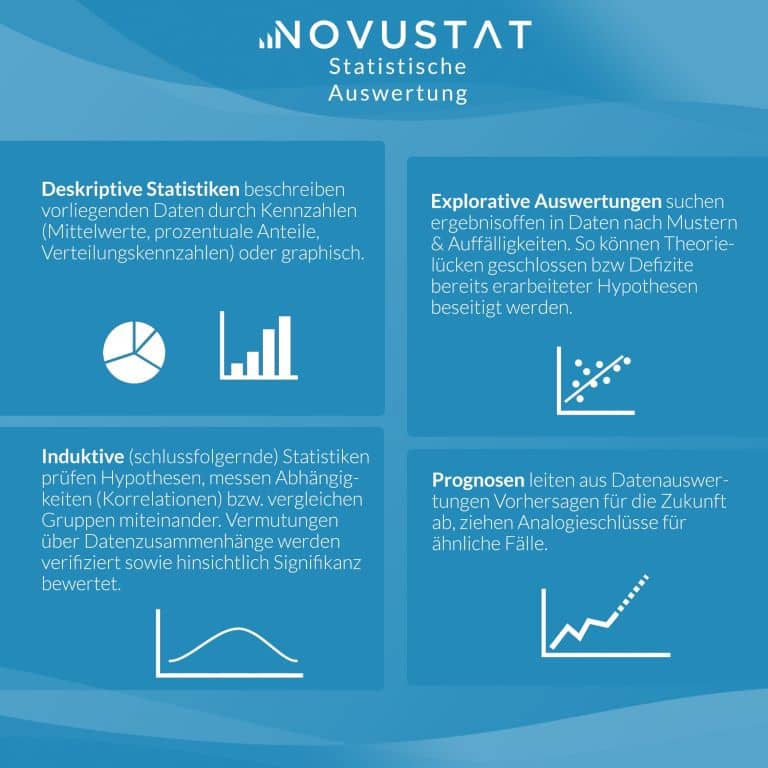
The way statisticians analyze data depends on whether the preceding study was intended to formulate or test hypotheses. In the former case, data aggregation leads to the desired result; in the latter, methods of inferential statistics are used. You can either take advantage of our statistical consulting services or entrust us with a complete statistical data analysis. If you would like to have your data analyzed in R, Novustat can assist you with data preparation, statistical modeling, reproducible analysis, and interpretation of results.
We start right at the data generation stage and, with the help of our extensively trained staff, conduct both written and telephone surveys on your behalf. Our range of services leading up to the statistical analysis also includes conducting experiments and modeling existing process data.
To ensure accurate statistical analysis, the data sets must be cleaned and thoroughly checked in advance. We would be happy to handle this for you.
We are well-versed in the jungle of statistical methods and software and will make the right choice for your datasets and analytical goals from a range of proven methods, such as SPSS analysis.
We provide comprehensive support, from manual data entry to questionnaire analysis.
We analyze the nature of your data pool and select the appropriate tools for further processing.
We are also happy to conduct meta-analyses for you—from literature reviews to comprehensive reporting.
Our statisticians will review your data, research question, and project goals and recommend the most appropriate analysis method.
Depending on the task at hand or the research question, we can advise you or take some of the burden off your shoulders regarding:
Testimonials and case studies illustrate how customers experience data analysis at NOVUSTAT. With a solid technical foundation and a proven track record in practice for more than ten years .






Senior statistician

We would be happy to assist you with the statistical analysis of your data. Our experienced statisticians will guide you through the process—from selecting the appropriate methods to providing a clear interpretation of your results. Take advantage of the academic expertise of our 80 statisticians and our experience with SPSS, Stata, R, SAS, and many other tools.
Depending on the data structure, research question, and desired analysis, we select the appropriate software for your project. Our selection ranges from traditional statistical software to specialized solutions for qualitative analysis, structural equation modeling, and technical applications. This ensures that every analysis is conducted in a methodologically sound, transparent, and efficient manner.
For statistical analyses, we use the following proven tools, among others:

Spreadsheet, suitable for data entry and graphical representation of data; capable of performing simple calculations such as mean, percentages, or standard deviation
A professional open-source program with a wide variety of packages for a wide range of statistical analyses. Programming skills are required.
Professional commercial statistics software for advanced data analysis
Window-based software for statistical data analysis; all essential statistical analyses, syntax, and graphics (e.g., histograms) can be generated upon request.
For numerical calculations or technical applications
A Covariance-Based Approach for Estimating Structural Equation Models
A variance-based approach to analyzing structural equation models; a good method for drawing conclusions about the population
Qualitative content analysis for coding open-ended questions, interviews, conversations, and more—text analysis
We can incorporate additional programs and specialized software solutions into your project upon request.


CEO & Founder
·
NOVUSTAT GmbH

Whenever research projects, scientific and technical experiments, or professional SPSS, Stata, or AMOS analyses require the highest level of accuracy to support corporate strategic decisions, Novustat provides the ideal expertise to ensure reliable results.
As a renowned provider of statistical services with experts from the business and academic worlds, we are able to meet even the most demanding requirements in the fields of statistics, interdisciplinary data analysis, and statistical evaluation.
NOVUSTAT can advise you on data analysis or handle it entirely for you. This step focuses on the statistical processing of the data collected earlier. Successful implementation requires that the data be suitable for a test-theoretical analysis —that is, that it be unambiguously quantifiable. Furthermore—for example, in the case of experimental series—sufficiently precise operationalizations must have been carried out to ensure that data collection is based on the necessary degree of objectivity.
Especially in the case of extensive studies , the reliability of the collected data is a key factor in determining the usefulness of the subsequent analysis. In descriptive statistics, it is impossible to condense the information contained in analyses by generating key figures without a thorough understanding of various evaluation methods and the proper interpretation of the numerical results obtained through them.
We would be happy to advise you individually and without obligation – just get in touch with us.

Before data analysis can begin, several preparatory steps must be taken. These include familiarizing oneself with the content, reviewing the research questions and hypotheses, and carefully examining and cleaning the data. Only after data quality, plausibility, outliers, and distribution have been checked can the subsequent statistical analysis be carried out reliably and in a methodologically sound manner.
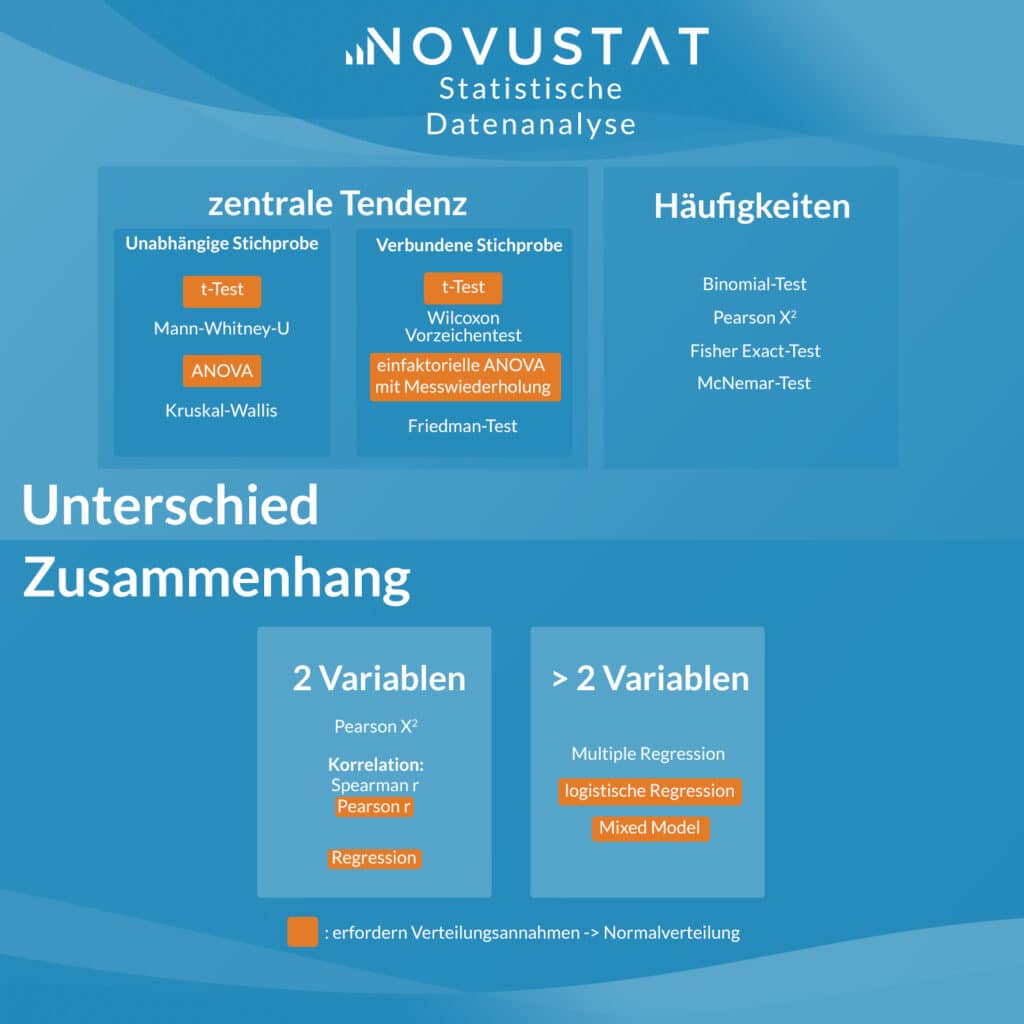
A crucial step in statistical data analysis is selecting the appropriate method. This choice depends on the research question, the measurement scale of the data, their distribution around the mean (normal or otherwise), and whether two samples are related or independent of each other. For example, the research question may aim to investigate the (in)dependence between variables or samples, or to test a hypothesis. The key criteria for selecting the appropriate statistical analysis method are primarily based on the following:
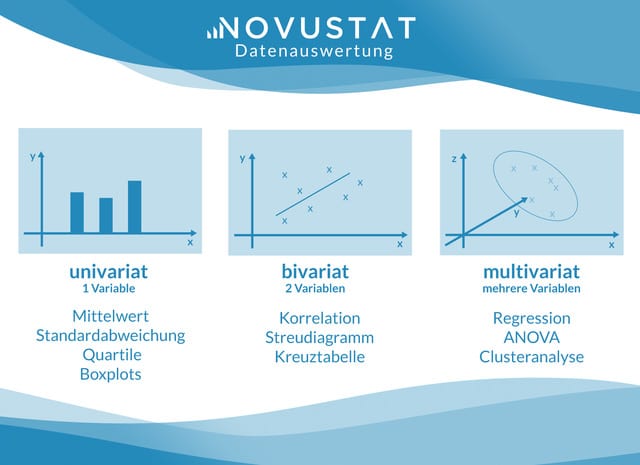
Quantitative data analysis involves numerical values. However, these values can belong to different scale levels:
| Assistance with getting (back) started with SPSS | Personalized SPSS help tailored to your needs, coaching |
|---|---|
| Step-by-step guides in SPSS for statistical analysis of all levels of complexity | Research projects, term papers, theses such as bachelor’s and master’s theses, and doctoral dissertations |
| Sample applications using your data sets | Reliability analysis, exploratory factor analysis, cluster analysis, discriminant analysis,... |
| Data Definition | Data Entry in SPSS Statistics, Coding Categorical Variables, Assigning Value and Variable Labels, Missing Values |
| Analyses in SPSS Statistics | Procedure, Conducting Analyses |
| Data Modifications | Recode, transform, calculate, DO IF, etc. |
| Data Selection | Sorting, filtering, subgroup analysis, selecting,... |
| Graph creation in SPSS | Customized to your specifications |
The term “distribution of the variables” refers to theoretical, model-based distributions centered around the mean, such as the normal distribution, the binomial distribution, the t-distribution, and so on. In other words, these distributions indicate the probability of individual values occurring. When the sample size is large, many distributions can be approximated by the normal distribution.
With the IBM SPSS Statistics software package—which, like Stata, features a modular structure—for the statistical analysis of data, Novustat offers a valuable introduction and tutorial, particularly for undergraduate and graduate students who do not yet have sufficient experience using SPSS, as they often do not receive enough instruction on how to use the software during their studies. Our SPSS introduction to data analysis includes:
The type of statistical test used for statistical analysis also depends on whether the samples are dependent or independent. The following criteria are applied:
The type of statistical test used for statistical analysis also depends on whether the samples are dependent or independent. The following criteria are applied:
Samples are considered dependent or related when the values in one sample influence the values in the other sample. Consequently, these are usually before-and-after comparisons using the same sample. If a respondent has high baseline values, the values may also be high after the intervention.
Measurements recorded for two or more different groups of elements are called independent. The values in one sample contain no information about the values in the other sample.
Benefit from professional statistical data analysis for your project. Simply use our contact form to request a free consultation and a no-obligation quote—or give us a call.
In addition, there are a variety of other methods for statistical analysis, such as structural equation modeling. Statistical tests used to verify certain assumptions are also very common (for example, the Shapiro-Wilk test, the Kolmogorov-Smirnov test, the Levene test for homogeneity of variances, and many others). Textual data is analyzed using text analysis or text mining methods. Data mining methods, on the other hand, are used in big data applications.
We can only introduce the most important analytical methods and the differences between them. Statistics is a field with a wealth of methods, and there is a suitable one for every purpose. Nevertheless, the various methods of data analysis differ from one another and must be chosen wisely. Typically, however, different statistical methods applied to the same data lead to different results and conclusions about the population. Whether descriptive or inductive —it is therefore crucial not to make a mistake when selecting a method.
Whenever you need to analyze data in an academic or professional context, or require training in data analysis, working with NOVUSTAT guarantees success! We have a large pool of highly qualified, academically trained experts with practical experience who are capable of tackling any statistical challenge and will ensure your project is completed successfully , conscientiously, and on schedule.
Right from your first visit to our website, you’ll have the opportunity to get a realistic idea of the expected costs of hiring us. Once you’ve sent us your specific requirements, you’ll receive a detailed quote. If you decide to work with us in the next step, we will assign a personal account manager to you who will serve as your point of contact throughout all phases of the project and give you the opportunity to actively influence the design and progress of the data analysis at any time. Our sophisticated process organization ensures optimal result quality in every case through peer-to-peer checks throughout the work and a final comprehensive review by a supervisor.

 Privacy Preference
We need your consent before you can continue on our website. We use cookies and other technologies on our website. Some of them are essential, while others help us to improve this website and your experience. Personal data may be processed (e.g. IP addresses), for example for personalized ads and content or ad and content measurement. You can find more information about the use of your data in our privacy policy. You can revoke or adjust your selection at any time under Settings.
Privacy PreferenceWe use cookies and other technologies on our website. Some of them are essential, while others help us to improve this website and your experience. Personal data may be processed (e.g. IP addresses), for example for personalized ads and content or ad and content measurement. You can find more information about the use of your data in our privacy policy. Here you will find an overview of all cookies used. You can give your consent to whole categories or display further information and select certain cookies.